You can also watch video directly on YouTube to see what caused the housing market crash and the Great Recession.
Housing Bubble Explained Clearly
As a real estate agent in the bubble city of Phoenix, I often wondered what the hell was happening during the Great Real Estate Bubble.
10 years after the peak of the boom I was still confused because everyone was blaming everyone else for the Bubble and the Great Recession.
Being a geeky guy and a former economist, I decided to try and figure it out for myself.
It took 2 months but now I have a good feel for what actually happened – it was caused by basic economics.
[If you’ve wondered if I fell off the face of the earth the last couple of months, this project is why.]
What Do You Think?
- What did I get right?
- What did I get wrong?
I’d love to hear your comments and I’d love to hear about your experiences in the Great Real Estate Bubble.
More…
Also, here’s a follow up post I did with 18 cool graphics about The Great Real Estate Bubble that I didn’t use in the video.
Video Transcript & Graphics
The Great Real Estate Bubble – Explained
Money Chasing Homes
[Click any graphic below to enlarge it.]
When the Great Real Estate Bubble burst in 2008, it triggered the worst recession since the Great Depression.
You would think that 10 years after the Bubble’s peak we would have come to some agreement on what caused it and how to prevent another one.
But, nope. There’s still no consensus after all these years.
So I spent a couple of months trying to figure it out for myself and found an easy way to explain the basic economics behind the Great Real Estate Bubble.
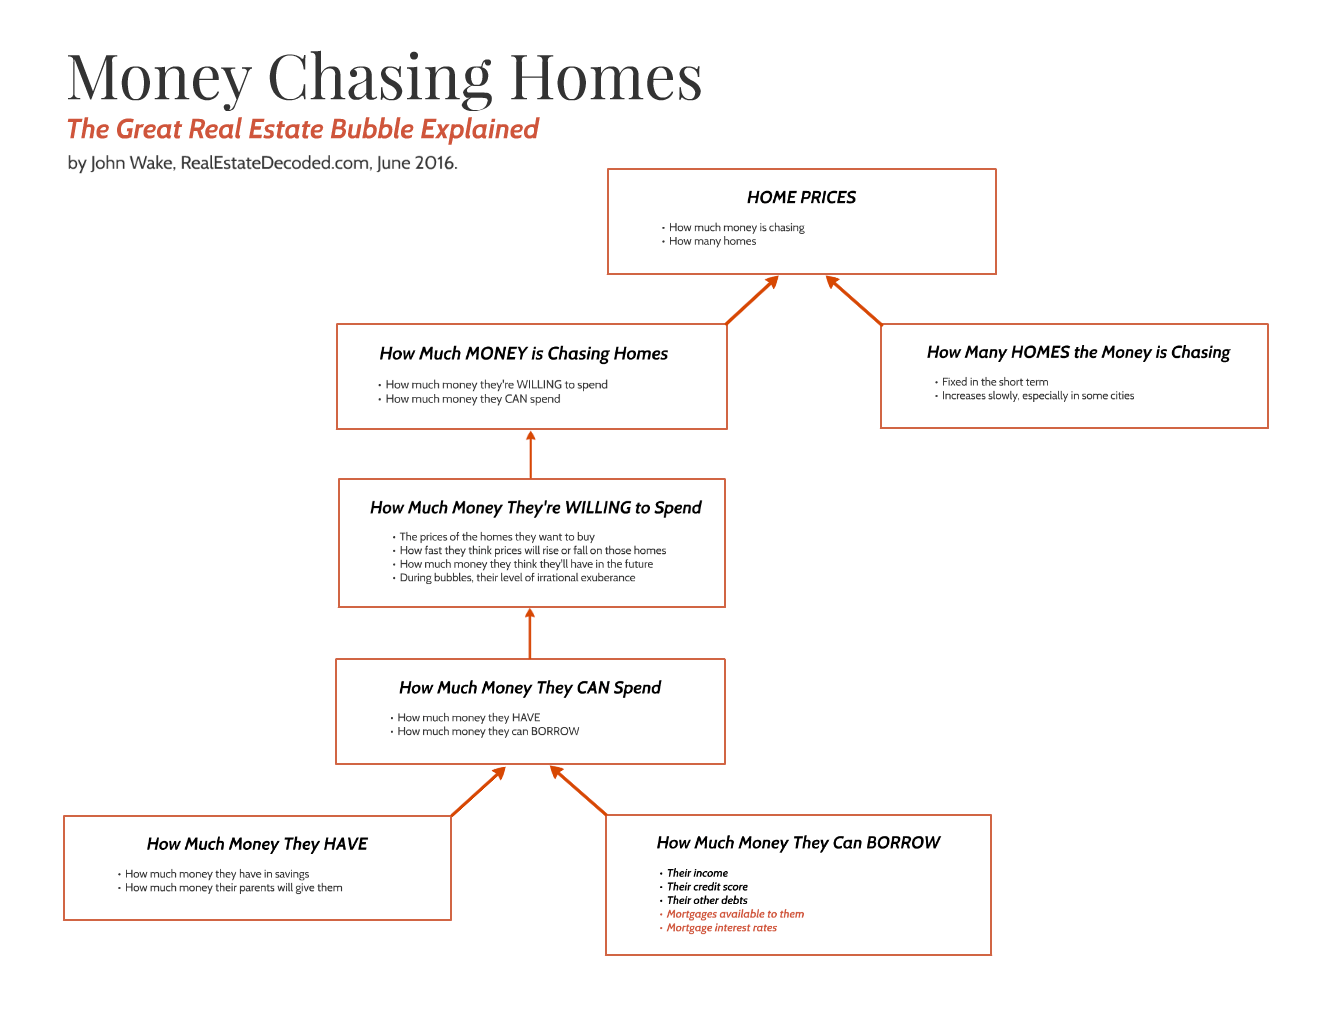
Money Chasing Homes
Economists like to say about inflation that prices are determined by how much money is chasing how many goods.
The “how much money” part measures demand and the “how many goods” part measures supply.
It turns out this simple framework also works GREAT for explaining the boom and bust of home prices in the Great Real Estate Bubble.
So let’s get back to basics and look at “How much money was chasing how many homes” in the Great Real Estate Bubble.
Inelastic Supply
First, let’s look at the second part, “How many homes.”
Homes are the textbook example of what economists call inelastic supply.
Most products are kinda like iPhones. If the new iPhone is a hit, great! Apple makes a zillion more iPhones but they don’t increase the price.
Homes are different.
If your town suddenly became super cool and cool people everywhere wanted to move there, home prices would skyrocket. The supply of homes is fixed in the short term so even small increases in the amount of money chasing homes can cause big increases in home prices.
In the long term, in cities where it’s easy to build new homes, prices will come back down but in cities where it isn’t, they won’t.

Source: “Regionally, Housing Rebound Depends on Jobs, Local Supply Tightness.” Duca. Dallas Fed. 2014.
Now, let’s go back and look at the first part of the equation, “How much money.”
Two factors determine how much money is chasing homes; how much money people have and how much money people can borrow.
And two huge factors in determining how much money people can borrow are interest rates and how loose mortgage companies are with their money… or with someone’s money.
1990s
From the early 1990s to the peak of the Great Real Estate Bubble, mortgage companies became a helluva lot looser with their money… or with someone’s money.
They loosened up slowly at first but then faster and faster and crazier.
FHA became looser. Fannie and Freddie became looser.

Source: “Government Housing Policies in the Lead-up to the Financial Crisis: A Forensic Study” (187-page pdf). Pinto. 2011.
Subprime companies became looser and, in addition, the number of subprime mortgages skyrocketed.

Note. Graph was originally found at https://www.fdic.gov/bank/analytical/regional/ro20041q/na/infocus.html but that page is no longer online.
Source: “Housing Bubble Concerns and the Outlook for Mortgage Credit Quality.” FDIC. 2004.
Back in the early 1990’s, if you couldn’t get a “prime” mortgage, you might not be able to get a mortgage at all.
Then some small enterprising mortgage companies started to sell high cost, “subprime” mortgages to people with iffy credit histories who couldn’t get low cost, prime mortgages.
By the late 1990’s, easier mortgages and a strong economy were making a lot more money available to chase homes. Home prices started to rise fast in some cities. For example, the home price index for Los Angeles increased 14% in 1998 alone.

Source: “Housing Bubble View of Case-Shiller Home Price Index (1995 Baseline).” Real Estate Decoded.
Early 2000s
Then the Dot-Com Bubble burst in 2000, the stock market crashed and a recession began.

To pump up the economy, the Federal Reserve lowered interest rates drastically.
Interest rates on 30-year fixed rate mortgages fell 3 percentage points from 2000 to 2003.

Source: FRED, Federal Reserve Bank of St Louis. 2016.
The lower rates meant people could borrow a LOT more money to chase homes, if they wanted to anyway.
With the same monthly payment, you could borrow nearly 40% more money in 2003 compared to 2000. If you switched to an adjustable rate mortgage, you could borrow 60% more. If you switched to a subprime mortgage, you could borrow even more.
Los Angeles, for example, already had a tight real estate market and its economy wasn’t as hard hit hard as others by the Dot-Com Bubble, so the new, low interest rates sort of freed home prices in LA to rise.

Source: “Housing Bubble View of Case-Shiller Home Price Index (1995 Baseline).” Real Estate Decoded.
Higher prices made people want to buy homes right away before prices increased even more. So prices increased even more.
With the rapidly rising home prices, subprime mortgages became more popular because people wanted to borrow more and more people wanted to borrow.
Everyone was talking about home prices. It was as if the Dot-Com mania simply shifted over to real estate.

Source: “The 1998-2005 Housing ‘Bubble’ and the Current ‘Correction’: What’s Different this Time?” (26-page pdf). Wheaton and Nechayev. 2008.
California real estate speculators were making big bucks. Some took their winnings and moved on to Las Vegas and Phoenix which triggered bubbles there.

Source: “Housing Bubble View of Case-Shiller Home Price Index (1995 Baseline).” Real Estate Decoded.
I should mention that most U.S. cities did NOT have real estate bubbles.

Source: “Financial Crisis Inquiry Commission Report” (663-page pdf). 2011.
Homebuyers in non-bubble cities could have borrowed a lot more money to chase after homes, if they wanted to, but they didn’t want to. So why not?

Source: “Regionally, Housing Rebound Depends on Jobs, Local Supply Tightness.” Duca. Dallas Fed. 2014.
Most likely they didn’t need to. Their real estate markets weren’t that tight. Homebuyers could find homes they wanted to buy without borrowing more money and bidding up prices.
And part of it MIGHT be that the people in the non-bubble cities were just less comfortable taking risks than the people in California and Florida.

They avoided taking on bigger and riskier mortgages even though they could have. Upward price spirals never really got started.
Refinancing Boom
Mortgage interest rates fell throughout 2001 and 2002 so a huge number of people decided to refinance their homes.
When they switched into lower interest rate mortgages, many people also got LARGER mortgages. That way they could get “cash-out” when they refinanced. They ended up with less equity in their homes but more cash.
In 2003, an incredible 20% of U.S. homeowners with mortgages refinanced their homes.
About half of all mortgages made in 2004, 2005 and 2006 were refinancings.
Home prices had skyrocketed which meant people could get huge cash outs if they wanted to. They could get even bigger cash outs if they refinanced into low down payment subprime mortgages.
Unfortunately, they ended up with less equity which would come back to bite some people when home prices tanked after the bubble burst.
Subprime Boom
As the refinancing boom was ending in 2003, the subprime mortgage boom really started to take off.

Source: “Competition and Crisis in Mortgage Securitization” (60-page pdf). Simkovic. 2011. (Slides)
And at the same time subprime mortgages were getting riskier. Credit scores fell. Down payments fell. Maximum loan amounts rose. Fraud rose.

Source: “The Past, Present, and Future of Subprime Mortgages” (35-page pdf). Sherlund. 2008.
Subprime lending standards fell so far that from 2005 to 2007 the median subprime mortgage had no down payment!
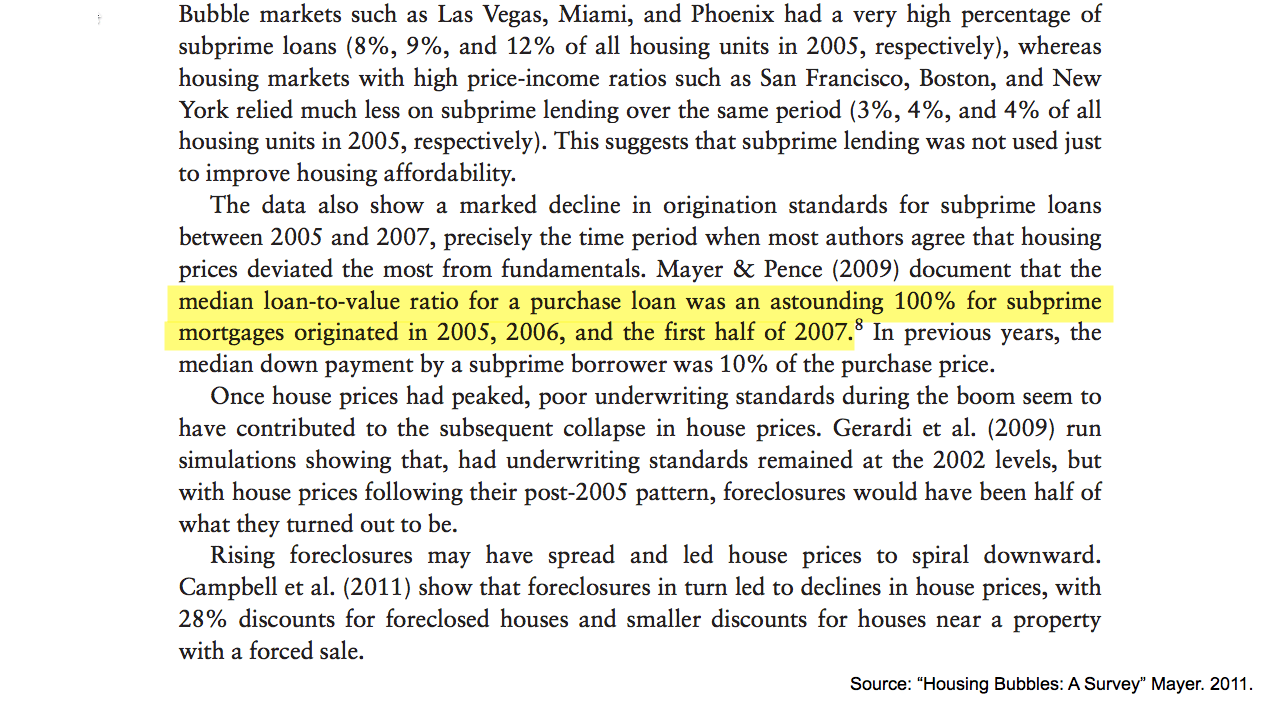
Source: “Housing Bubbles: A Survey”. Mayer. 2011.
And by 2006, half of all mortgages were subprime!

Source: “Guaranteed to Fail” (151-page pdf). Acharya, Richardson, et al. 2011.
Some people chose subprime because they couldn’t get prime mortgages. Others choose subprime so they could borrow more money.
Either way, the increase in subprime mortgages meant people could borrow a LOT more money to chase homes, if they wanted to anyway.
Combined with the low interest rates, home prices absolutely skyrocketed in the bubble cities during 2004 and 2005.

Source: “Housing Bubble View of Case-Shiller Home Price Index (1995 Baseline).” Real Estate Decoded.
On top of this, the Fed began slowly increasing interest rates in 2004.

Source: FRED, Federal Reserve Bank of St Louis. 2016.
But instead of slowing things down, people became even more manic about buying homes right away before the low interest rates were gone forever.
Peak
Eventually, home prices got so high in the bubble cities that the market psychology changed from,
“These home prices seem crazy high but they’re increasing crazy fast so let’s buy a home ASAP,”
to simply,
“These home prices seem crazy high and they’re not increasing crazy fast anymore so let’s wait and see.”
The spell was broken.
And anyway, pretty much anyone with any inkling to buy a home already had bought one… or two.
In 2005, the number of home sales peaked.
In 2006, home prices peaked.
The spell, however, wasn’t broken for the mortgage industry.

Source: “Competition and Crisis in Mortgage Securitization” (60-page pdf). Simkovic. 2011. (Slides)
They continued to lower their lending standards in a desperate attempt to keep the music playing.
Bust
Many subprime mortgages made in 2005, 2006 and 2007 – especially no-money-down mortgages – made it rational for investors to stop paying their mortgages as soon as they realized home prices weren’t INCREASING anymore.
If they put no money down, the only money they lost was the first few monthly payments they made. The sooner those investors stopped making payments, the smaller their losses.

Source: “Competition and Crisis in Mortgage Securitization” (60-page pdf). Simkovic. 2011. (Slides)
In 2006, after home prices stopped increasing, foreclosures started increasing.
By 2007, home prices started to fall and foreclosures of subprime mortgages started to take off.
By 2008, foreclosures of PRIME mortgages started to take off and home prices in bubble cities began to freefall.
Then the stock market began to freefall.
And then the government stepped in with the first in a series of huge financial interventions.
By the time home prices finally bottomed out in 2012, home prices had fallen 30% nationally, 40% in Los Angeles, 50% in Miami, and 60% in Las Vegas.
Impact
The Great Real Estate Bubble triggered the Great Recession which turned out to be the deepest and longest recession since the Great Depression.

Source: Calculated Risk. McBride. 2014.
Here’s why.
When the stock market falls, it doesn’t have a huge impact on the wealth of lower-income Americans, they don’t own stock.

Source: “Homeownership, the Great Recession, and Wealth: Evidence from the Survey of Consumer Finances” (35-page pdf). Grinstein-Weiss and Key. 2013. (Slides)
Remember how quickly the economy bounced back from the 50% crash in the stock market in the 2000 Dot-Com Bubble.
When home prices fall 30%, however, it hurts a lot more people and it wipes out most of what little wealth lower income Americans have, so consumer spending crashes hard.

Source: “Mortgage Design, Household Debt And The Macro-economy” (24-page pdf). Mian. 2015.
That’s why the worst recessions, like the Great Recession, are usually tied to real estate bubbles.
Conclusion
I think the “Money Chasing Homes” framework does a great job of decoding the chaos of the Great Real Estate Bubble.
It even partially explains why during the bust we saw home prices fall in cities that didn’t even have booms. After the bubble burst, mortgage companies freaked out and tightened lending standards everywhere. The money chasing homes was reduced everywhere, even in cities that didn’t have real estate booms.

Source: “Housing Bubble View of Case-Shiller Home Price Index (1995 Baseline).” Real Estate Decoded.
And currently, the “money chasing homes” framework helps explain why home prices are skyrocketing in Vancouver, the U.S. West Coast, Miami and some techy cities. It’s an influx of foreign and/or tech money chasing homes in those cities.

Source: “Housing Bubble View of Case-Shiller Home Price Index (1995 Baseline).” Real Estate Decoded.
The first step to preventing another Great Recession is to understand what caused the Great Real Estate Bubble.
I hope this video helped you get a better feel for what happened.
If you want more real estate decoded, please subscribe to my website RealEstateDecoded.com.
And if you’re watching on YouTube, please click the “Subscribe” or “Like” button.
Your questions and comments are welcome.
Flowchart
The “Money Chasing Home” flowchart is available as a pdf, image or slideshow.
Click graphics to enlarge.
Notes
Why. I don’t dive into why subprime mortgages expanded or lending standards fell. That’s more political science than economics. The “why” is super controversial and it’s super easy to go down a rabbit hole and get distracted from the basic economics of the Great Real Estate Bubble – money chasing homes.
“Subprime.” The definition of “subprime” is all over the place in the literature.
Many people, especially in the mortgage industry, don’t include “Alt-A” mortgages within their definition of subprime which seems crazy. Separating them out just confuses things and makes “subprime” mortgages look smaller than they really are. “Alt-A” mortgages are significantly below prime mortgages in quality so I include them in my definition of “subprime.”
In addition, there are other data problems in measuring the number of subprime mortgages but no matter how you slice it, there were a ton of subprime mortgages.
Just be aware that within the video, the definition of subprime may change depending on who’s study I’m referring to. The video isn’t as internally consistent as an academic paper would be. But to give you an overview of what happened in the Great Real Estate Bubble, I wanted to pull in all the best research I could find even if the different studies weren’t consistent in their definitions of subprime.
More Explanations of the Great Real Estate Bubble and/or Great Recession
- Report: “The Financial Crisis Inquiry Report,” Financial Crisis Inquiry Commission. 2011. A lot of gems are buried in this 663 page report but good luck finding them! I read a lot of it so you don’t have to. 🙂
- Book: “House of Debt,” Mian and Sufi. 2015. Video interview with authors.
- Book: “Fault Lines,” Rajan. 2011. Video interview with the author.
###
12 Responses to The Great Real Estate Bubble – Explained
John,
Im not a you tube kind of person. I can’t integrate as fast as information comes to me. Seriously, I have to play and replay. So for those of us slow to pick up verbal queues, would you be kind enough to provide a transcript. Im a much better reader! Philip in Philly.
Good idea! I’ll add the transcript to the bottom of the post.
Philip, I rearranged the whole post! Check it out and let me know what you think. I also inserted the graphics within the transcript. It’s more of a post now than a transcript.
You might want to check out “echo bubbles” which occur about 10 years after the initial bubble but not a severe as the original bubble. We are entering that period now and probably coincide with the next recession (2017/18?). House flipping shows are another indicator.
We’re on the same wavelength! By chance, I just made a comment 3 days ago on Ryan Lundquist’s appraisal blog about exactly this.
“About reality TV shows, the show “Flip This House” premiered on July 24, 2005, the exact the top of the market.
A show about foreclosure auctions called “Betting the House” started filming auctions in Phoenix in September 2011, the exact bottom of the market for home prices.”
http://sacramentoappraisalblog.com/2016/06/13/seeing-the-real-estate-market-without-numbers-and-a-big-sacramento-update/
Wow, John. That was quite extensive. I appreciate your hard work on this. Thanks for putting together so much data and helping tell the story of the market. I
Thanks, Ryan! I appreciate it.
And I’ve learned a ton from your “Sacramento Appraisal Blog,” http://sacramentoappraisalblog.com/.
Thanks again!
[…] More info on the Great Real Estate Bubble. […]
[…] Here are some of the cool graphics related to the Great Real Estate Bubble that I didn’t end up using in this post. […]
[…] my recent “Real Estate Bubble Explained” project, I found it was common for lenders to brag about their affordable mortgages. They were […]
Great post. This real estate market is so frustrating. During the uptick of prices I finally was able to save a nice down payment however I’m too skeptical to hand over all my hard earned money to just see it vanish in a few years from a market downturn. I hate renting and want a home so bad but I KNOW homes are at least 30% over valued where I live. I hope 2017 is the year the correction begins.
Comments are closed.